Analytics
See the data behind how Climate Change is impacting the World and Sri Lanka
In this page
- Global Statistics
- Future Projections
- Sri Lanka's Emission Data
Weather Today
23rd Sep 2023
Colombo
25 0 C
Jaffna
25 0 C
Galle
25 0 C
1. Global Statistics
Global Carbon-Dioxide Emissions
Download the DatasetGlobal Temperature Anomalies
Global Rise in Sea Levels 1
change in sea level in millimeters compared to the 1993-2008 average.
Download the DatasetGreenhouse Emissions by Sector
Emissions by Country
Emissions by Country - 2023
China
11.47 B Metric Tons/yr
31%
USA
5.02 B Metric Tons/yr
13%
India
2.71 B Metrict Tons/yr
7%
Russia
1.71 B Metric Tons/yr
5%
Japan
1.05 B Metric Tons/yr
3%
Just looking at current largest emitters can be misleading as many would point their finger at developing nations like China that are rapidly industrializing. Only when we look at the cumulative emissions we can see which countries have historically contributed most to the climate Change.
For example, Germany is one of the lowest emitting countries that is having most of their production processes carbon free today. But historically, Germany is one of the top nations in cumulative emissions.
Cumulative Emissions by Country 1850-2021 2
2. Future Projections
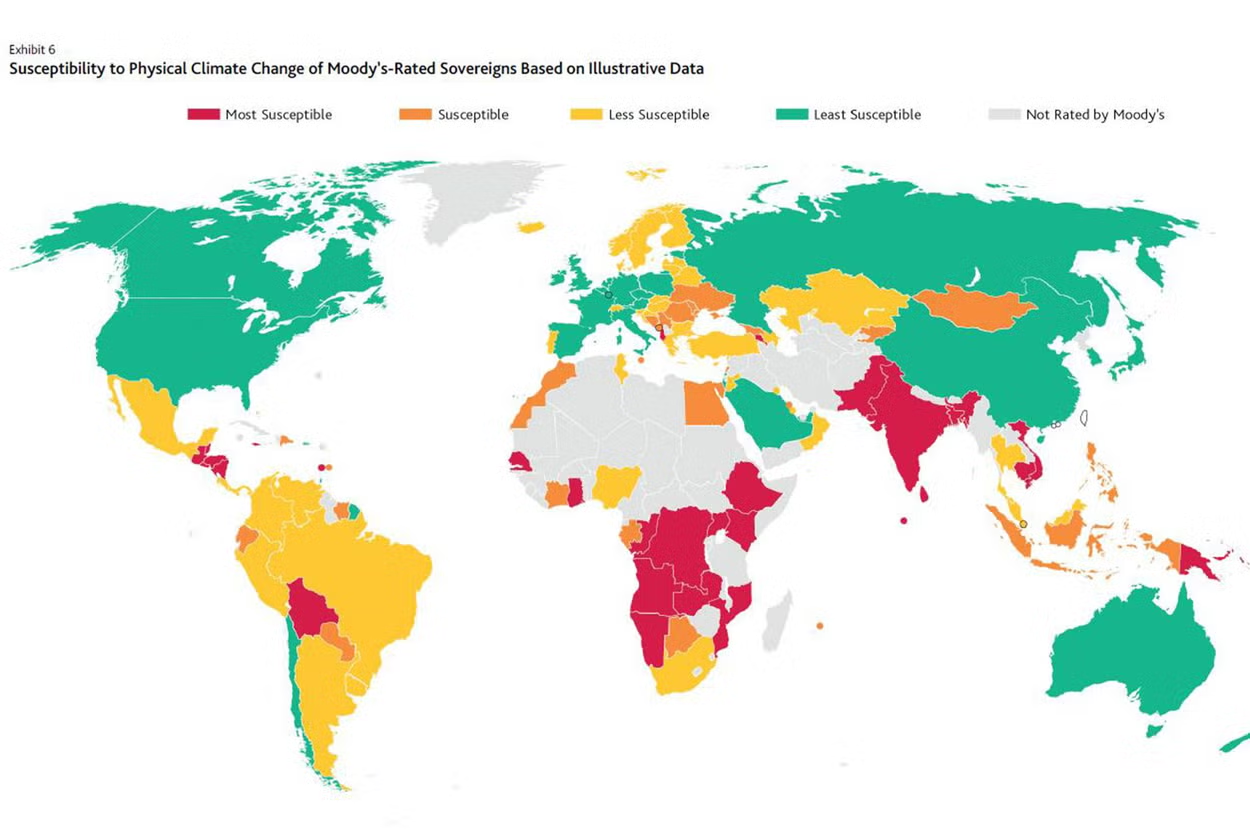
 3.Soverign rating - Climate Vulnerability
Sri lanka is one of the most vulnerable countries to the effects of climate change under many metrics. It's important to know which sectors might be most impacted by the effects of global warming. Being in the equator, each passing year feels hotter that the year before. Outdoor activities like agriculture too will be hindered since farmers cannot stay in the sun for long to avoid heat strokes.
It's interesting to see that certain countries least responsible for the climate change are the ones most affected by it. Yet, each and every person in earth is and will be facing the effects in one way or another.
poor-countries-in-the-world-hit-hardest3. Sri Lanka's Emission Data
Fossil CO2 Emissions (2022)
18,535,920 Tons
Global Share
0.05%
Tons per Capita
0.81
Monthly Surface Air Temperature- Sri Lanka 4
Surface air temperature: temperature of the air at or near the Earth's surface, typically measured at a height of 1.25 to 2 meters above ground
Download the DatasetTotal Greenhouse Gas Emissions by Year - Sri Lanka
Download the DatasetCO 2 Emissions by Year - Sri Lanka 5
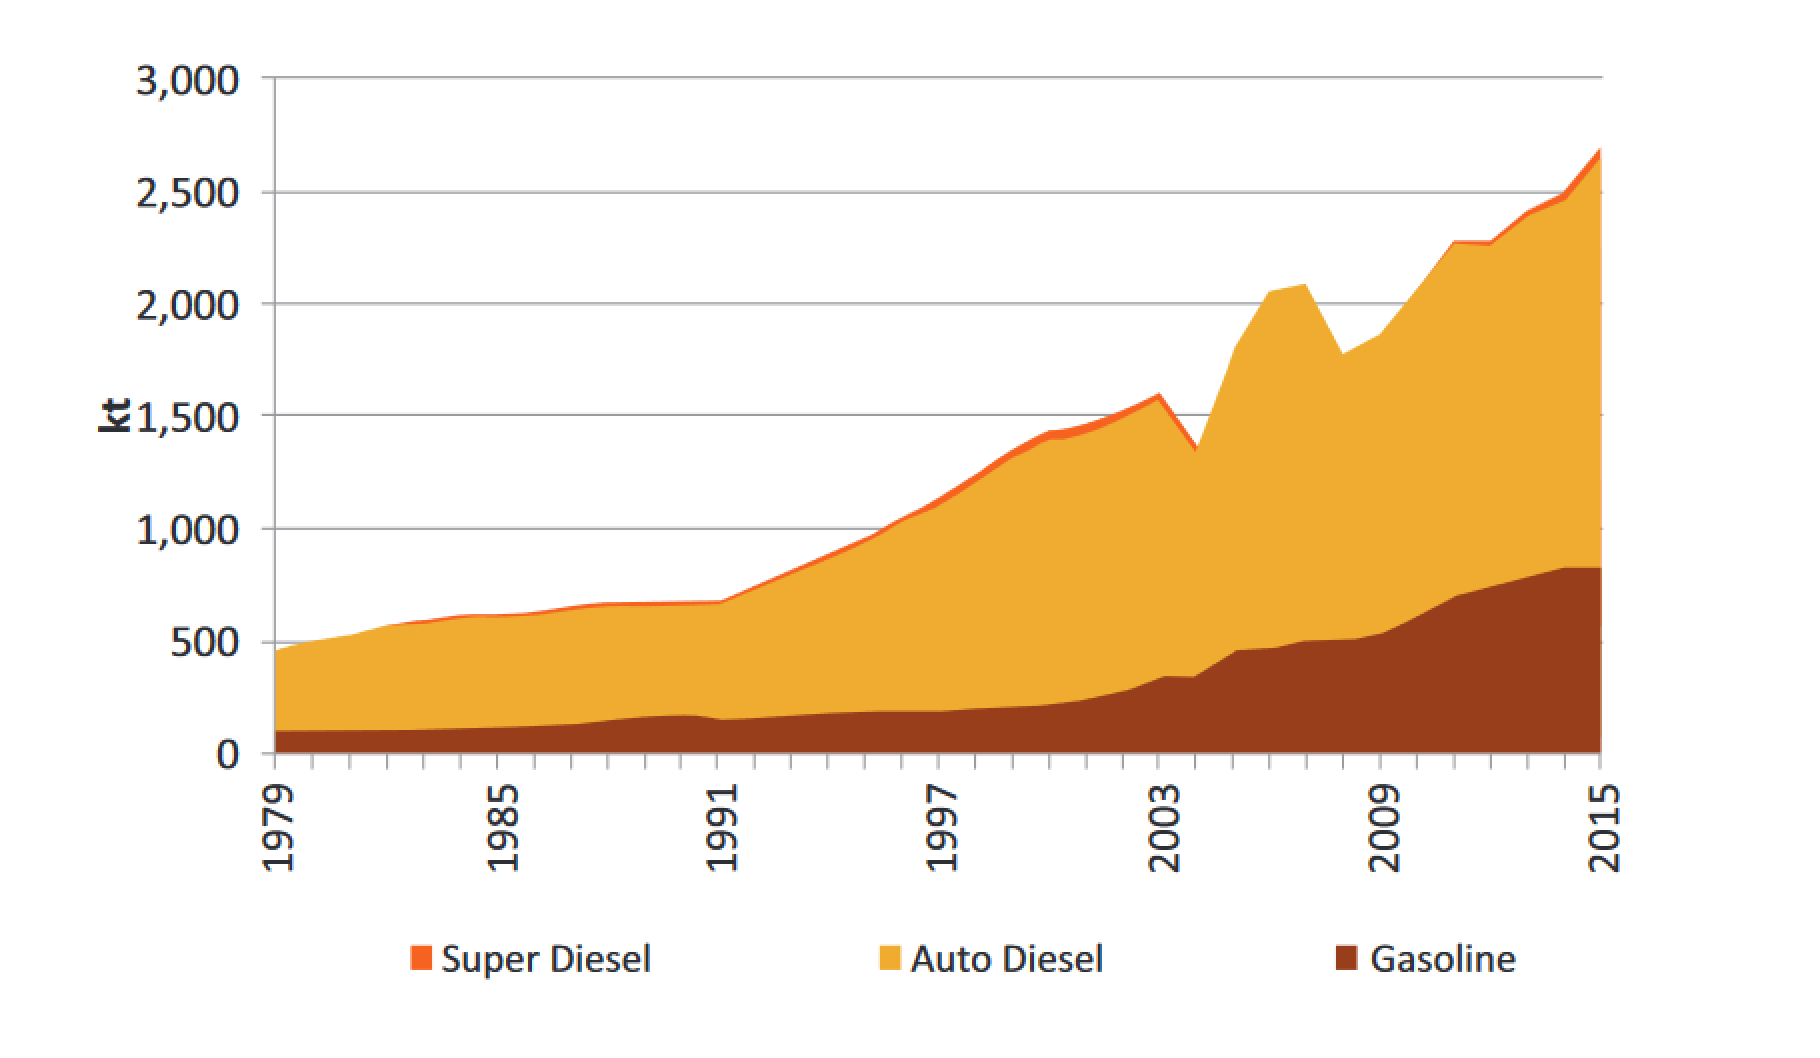
Fossil Fuel Consumption in Sri Lanka
 6.The Fuel Consumption in Sri Lanka too has exponentially increased alongside emissions
Overlapping with the global increase in the use of fossil fuels and greenhouse emissions, Sri Lanka too has been emitting more and more greenhouse gases each year. The goal should be to minimize the rapid increase of these emissions that directly influence our climate and in turn our very lives.